Generates single sample gene set scores across a datasets by many methods
Source:R/scoreSingleSamples.R
scoreSingleSamples.RdIt is common to assess the activity of a gene set in a given sample. There
are many ways to do that, and this method is analogous to the
seas() function in that it enables the user to run a multitude of
single-sample-gene-set-scoring algorithms over a target expression matrix
using a GeneSetDb() object.
scoreSingleSamples(
  gdb,
  y,
  methods = "ewm",
  as.matrix = FALSE,
  drop.sd = 1e-04,
  drop.unconformed = FALSE,
  verbose = FALSE,
  recenter = FALSE,
  rescale = FALSE,
  ...,
  as.dt = FALSE
)
Arguments
- gdb
A GeneSetDb
- y
An expression matrix to score genesets against
- methods
A character vector that enumerates the scoring methods you want to run over the samples. Please reference the "Single Sample Scoring Methods" section for more information.
- as.matrix
Return results as a list of matrices instead of a melted data.frame? Defaults to
FALSE.- drop.sd
Genes with a standard deviation across columns in
ythat is less than this value will be dropped.- drop.unconformed
When
TRUE, genes inythat are not found ingdbare removed from the expression container. You may want to set this toTRUEwhenyis very large until better sparse matrix support is injected. This will change the scores for gsva and ssGSEA, though. Default isFALSE.- verbose
make some noise? Defaults to
FALSE.- recenter, rescale
If
TRUE, the scores computed by each method are centered and scaled using thescalefunction. These variables correspond to thecenterandscaleparameters in thescalefunction. Defaults toFALSE.- ...
these parameters are passed down into the the individual single sample scoring funcitons to customize them further.
- as.dt
If
FALSE(default), the data.frame like thing that this funciton returns will be set to a data.frame. Set this toTRUEto keep this object as adata.table
Value
A long data.frame with sample_id,method,score values per row. If
as.matrix=TRUE, a matrix with as many rows as geneSets(gdb)
and as many columns as ncol(x)
Details
Please refer to the "Generating Single Sample Gene Set Scores" of the sparrow vignette for further exposition.
Single Sample Scoring Methods
The following methods are currenly provided.
"ewm": TheeigenWeightedMean()calculates the fraction each gene contributes to a pre-specified principal component. These contributions act as weights over each gene, which are then used in a simple weighted mean calculation over all the genes in the geneset per sample. This is similar, in spirit, to the svd/gsdecon method (ie.method = "gsd"``) You can use this method to perform an "eigenweighted" zscore by settingunscaleanduncentertoFALSE."ewz": withunscaleanduncenterset toFALSE`."gsd": This method was first introduced by Jason Hackney in doi:10.1038/ng.3520. Please refer to thegsdScore()function for more information."ssgsea": Using ssGSEA as implemented in the GSVA package."zscore": The features in the expression matrix are rowwise z transformed. The gene set level score is then calculated by adding up the zscores for the genes in the gene set, then dividing that number by either the the size (or its sqaure root (default)) of the gene set."mean": Simply take the mean of the values from the expression matrix that are in the gene set. Right or wrong, sometimes you just want the mean without transforming the data."gsva": The gsva method of GSVA package."plage": Using "plage" as implemented in the GSVA package
Examples
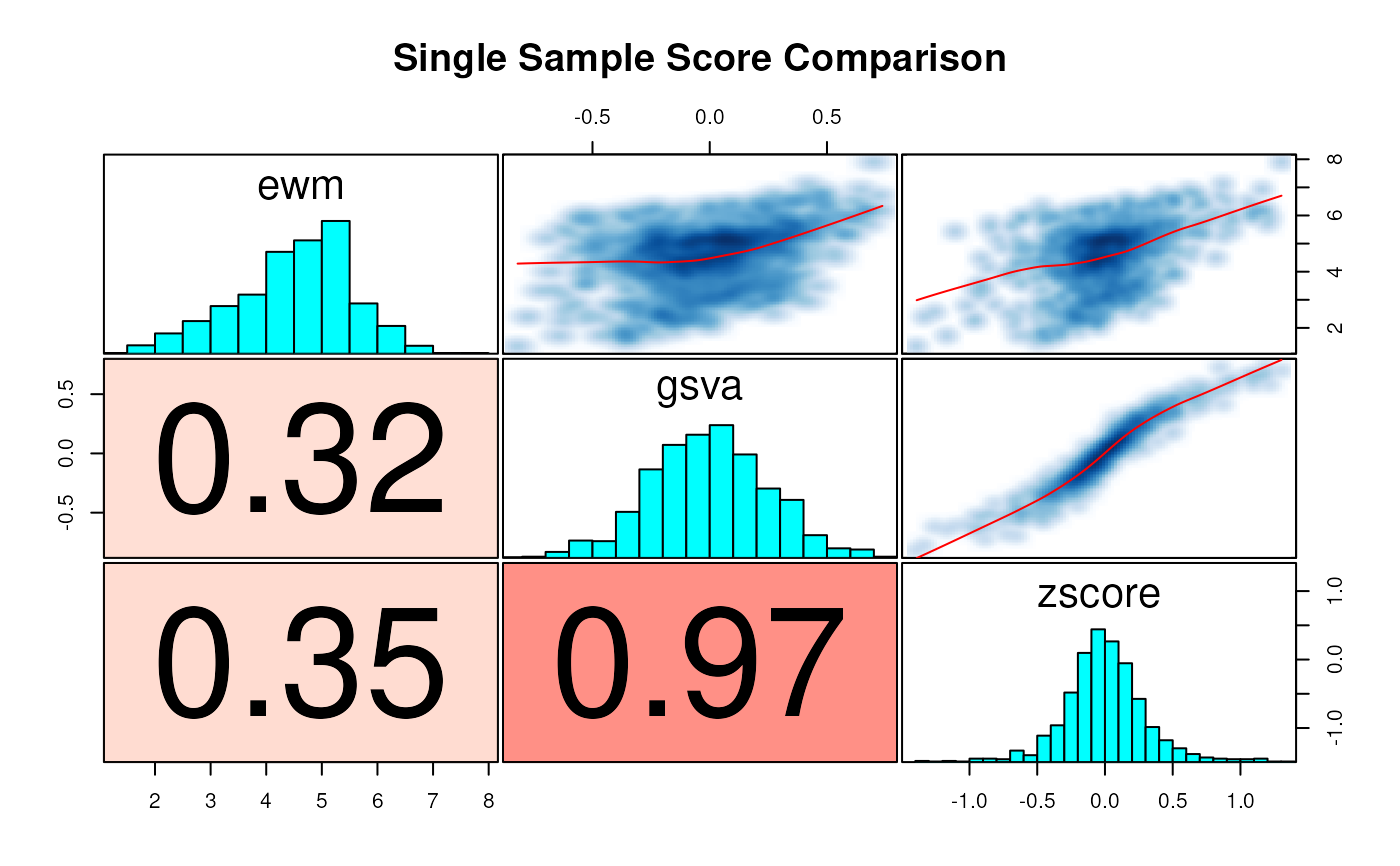
gdb <- exampleGeneSetDb()
vm <- exampleExpressionSet()
scores <- scoreSingleSamples(
  gdb, vm, methods = c("ewm", "gsva", "zscore"),
  center = TRUE, scale = TRUE, ssgsea.norm = TRUE, as.dt = TRUE)

sw <- data.table::dcast(scores, name + sample_id ~ method, value.var='score')

# \donttest{
corplot(
  sw[, c("ewm", "gsva", "zscore")],
  title = "Single Sample Score Comparison")
#> Warning: argument 1 does not name a graphical parameter
#> Warning: argument 1 does not name a graphical parameter
#> Warning: argument 1 does not name a graphical parameter
#> Warning: argument 1 does not name a graphical parameter
#> Warning: argument 1 does not name a graphical parameter
#> Warning: argument 1 does not name a graphical parameter

# }

zs <- scoreSingleSamples(
  gdb, vm, methods = c('ewm', 'ewz', 'zscore'), summary = "mean",
  center = TRUE, scale = TRUE, uncenter = FALSE, unscale = FALSE,
  as.dt = TRUE)
zw <- data.table::dcast(zs, name + sample_id ~ method, value.var='score')

# \donttest{
  corplot(zw[, c("ewm", "ewz", "zscore")], title = "EW zscores")
#> Warning: argument 1 does not name a graphical parameter
#> Warning: argument 1 does not name a graphical parameter
#> Warning: argument 1 does not name a graphical parameter
#> Warning: argument 1 does not name a graphical parameter
#> Warning: argument 1 does not name a graphical parameter
#> Warning: argument 1 does not name a graphical parameter

# }
# }