Plots the correlation among the columns of a numeric matrix.
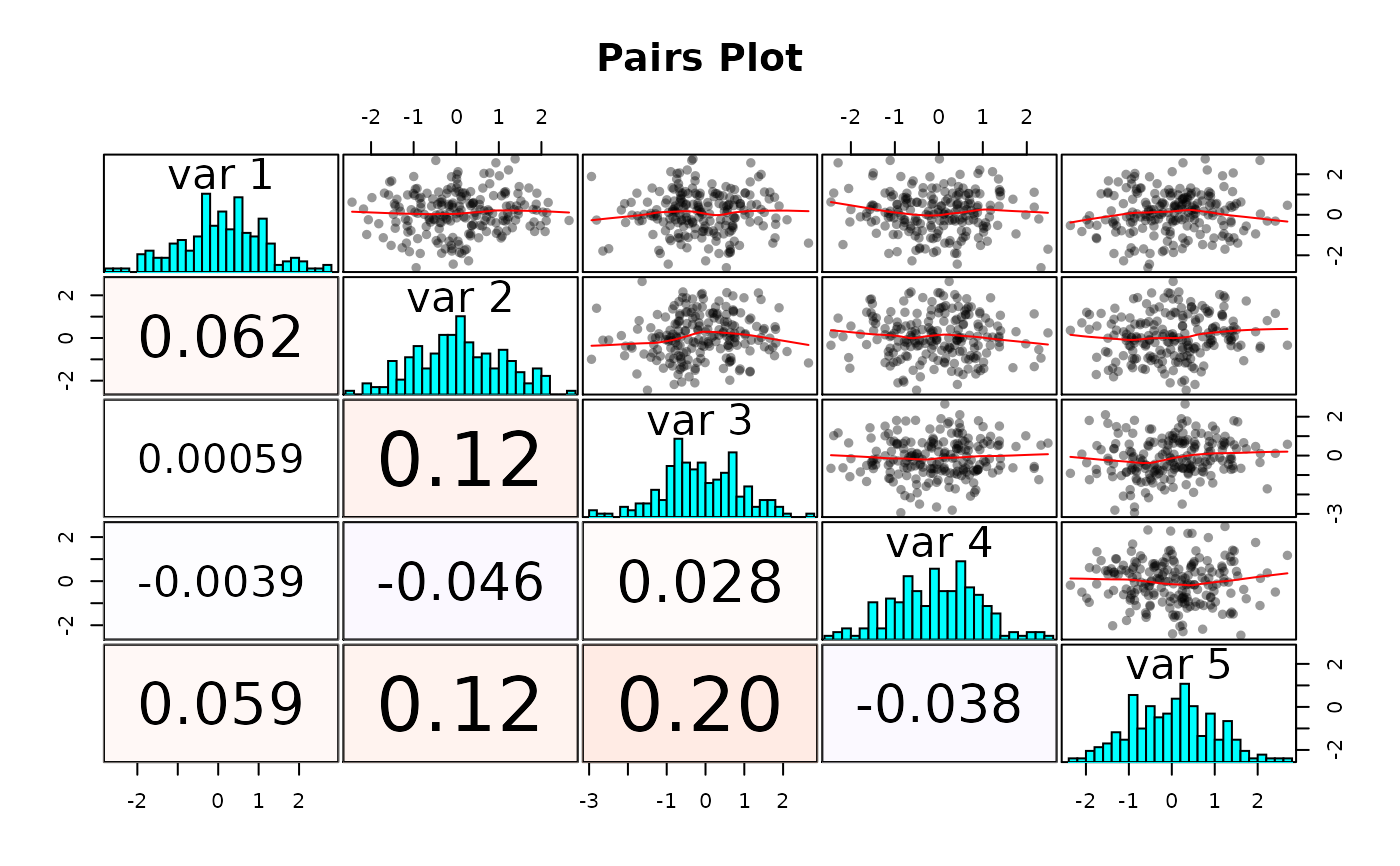
corplot.RdWe assume that this is a sample x gene expression matrix, but it can (of course) be any numeric matrix of your choosing. The column names appear in the main diagonal of the plot. Note that you might prefer the corrplot package for similar functionality, and this functionality is intentionally named different from that..
corplot(
  E,
  title,
  cluster = FALSE,
  col.point = "#00000066",
  diag.distro = TRUE,
  smooth.scatter = nrow(E) > 400,
  ...
)
Arguments
| E | the matrix used to plot a pairs correlation plot. The vectors used to assess all pairwise correlation should be in the columns of the matrix. |
|---|---|
| title | The title of the plot |
| cluster |
|
| col.point | the color of the points in the scatterplots |
| diag.distro | show the distribution of values on the diagnols? |
Value
nothing, just creates the plot
Details
TODO: Add with.signature parameter to allow a box to plot the signature score of all genes in E.
See also
The corrplot package